Outcomes
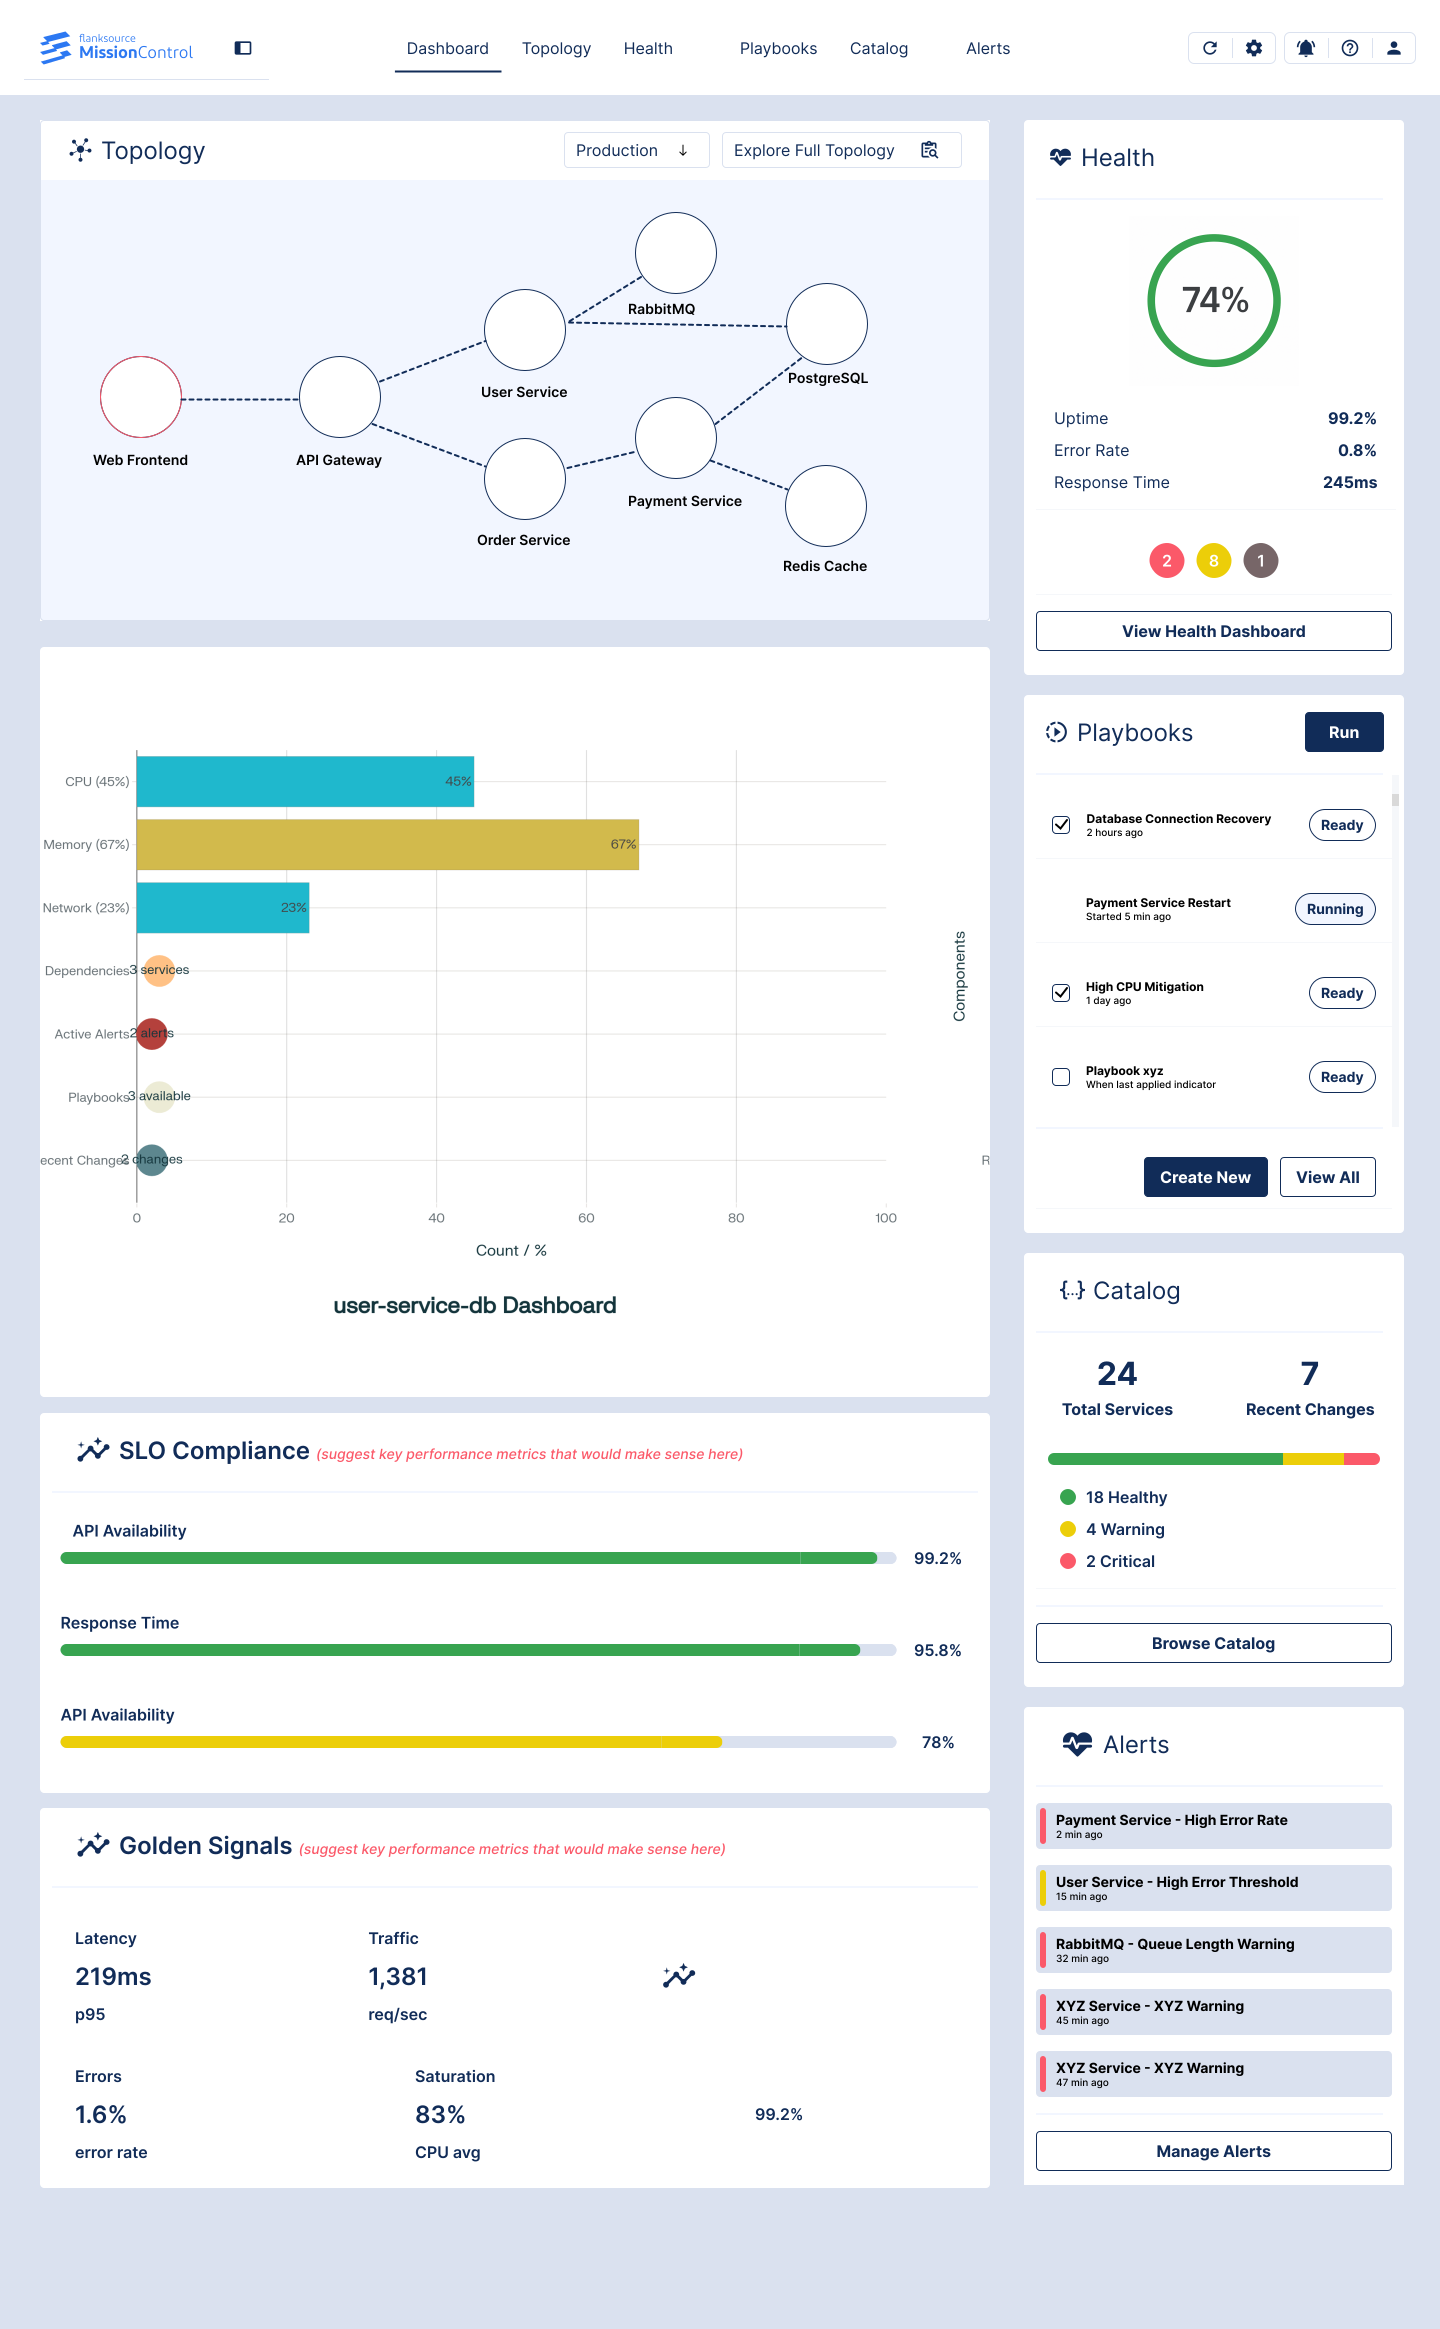
Unified dashboard communicating key system health metrics
Consolidated five major components into one view
Improved operational visibility for engineering teams
Flanksource began as a Kubernetes consulting firm. Teams were drowning in data but lacked context. They had metrics dashboards, log tools, and Git for config -- but nothing tying them together. Mission Control was built to close that gap.
Brief
Design a dashboard surfacing actionables and service health. Catalog, health checks, notifications, playbooks and topology in one view.
Topology
Playbooks
Catalog
Health Checks
Notifications
Process
01
Domain immersion
Terminology and component functions.
02
Data vis exploration
Methods to communicate system health.
03
Ideate and wireframe
Component data into dashboard layouts.
04
Structural design
Final representations for review.
Before and after
Before
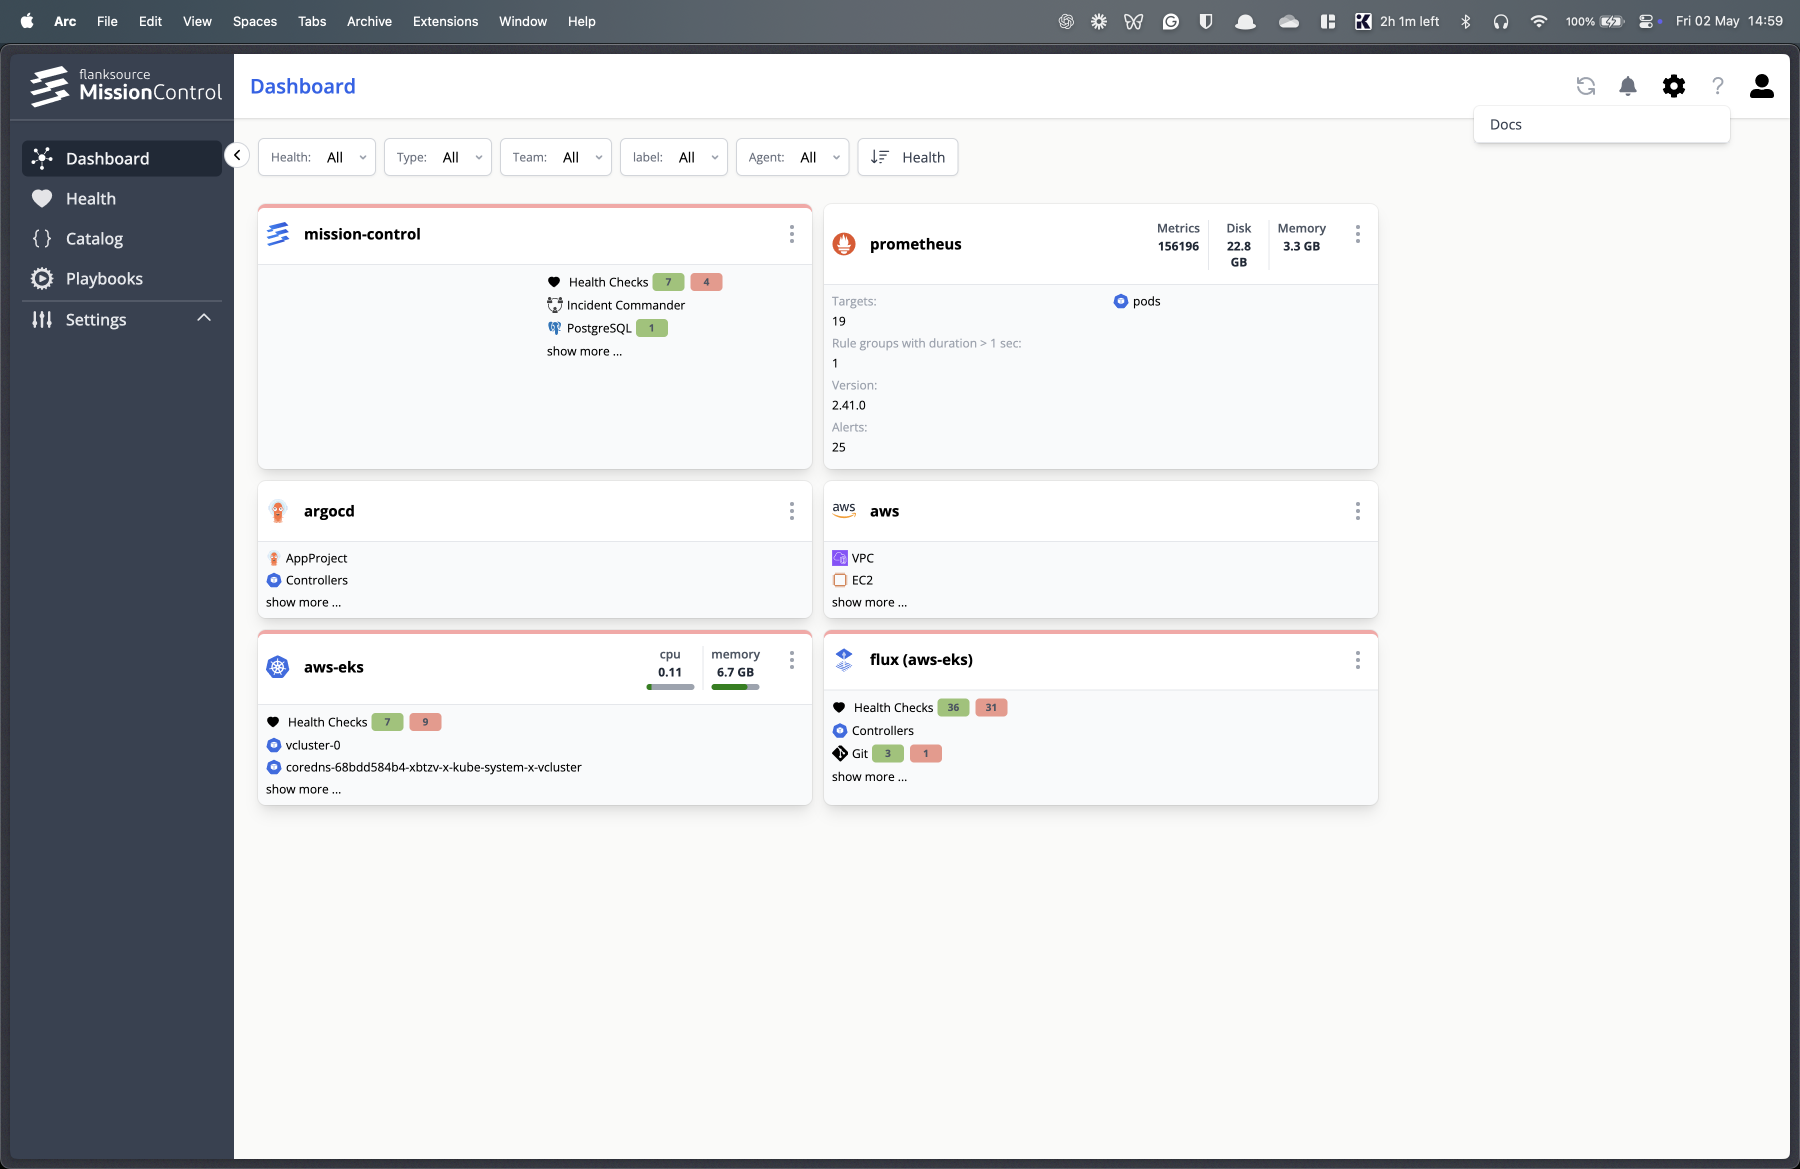
After
Insights
Engineers needed context, not more data
Key components were siloed across separate views
Actionable items were buried in individual tools
Unfamiliar terminology required deep domain learning
Reflection
Domain immersion is non-negotiable for unfamiliar products
Data density requires strict visual hierarchy